Visualising the state of global debt, by country

Since covid-19 started its spread around the world in 2020, the global economy has been put to the test with supply chain disruptions, price volatility for commodities, challenges in the job market, and declining income from tourism.
The World Bank has estimated that almost 97 million people have been pushed into extreme poverty as a result of the pandemic.
Global governments have responded by increasing their spending to deal with higher healthcare costs, unemployment, food insecurity, and to help businesses to survive. Countries have taken on new debt to provide financial support for these measures, which has resulted in the highest global debt levels in half a century.
To analyse the extent of global debt, VisualCapitalist.com compiled debt-to-GDP data by country from the most recent World Economic Outlook report by the IMF.
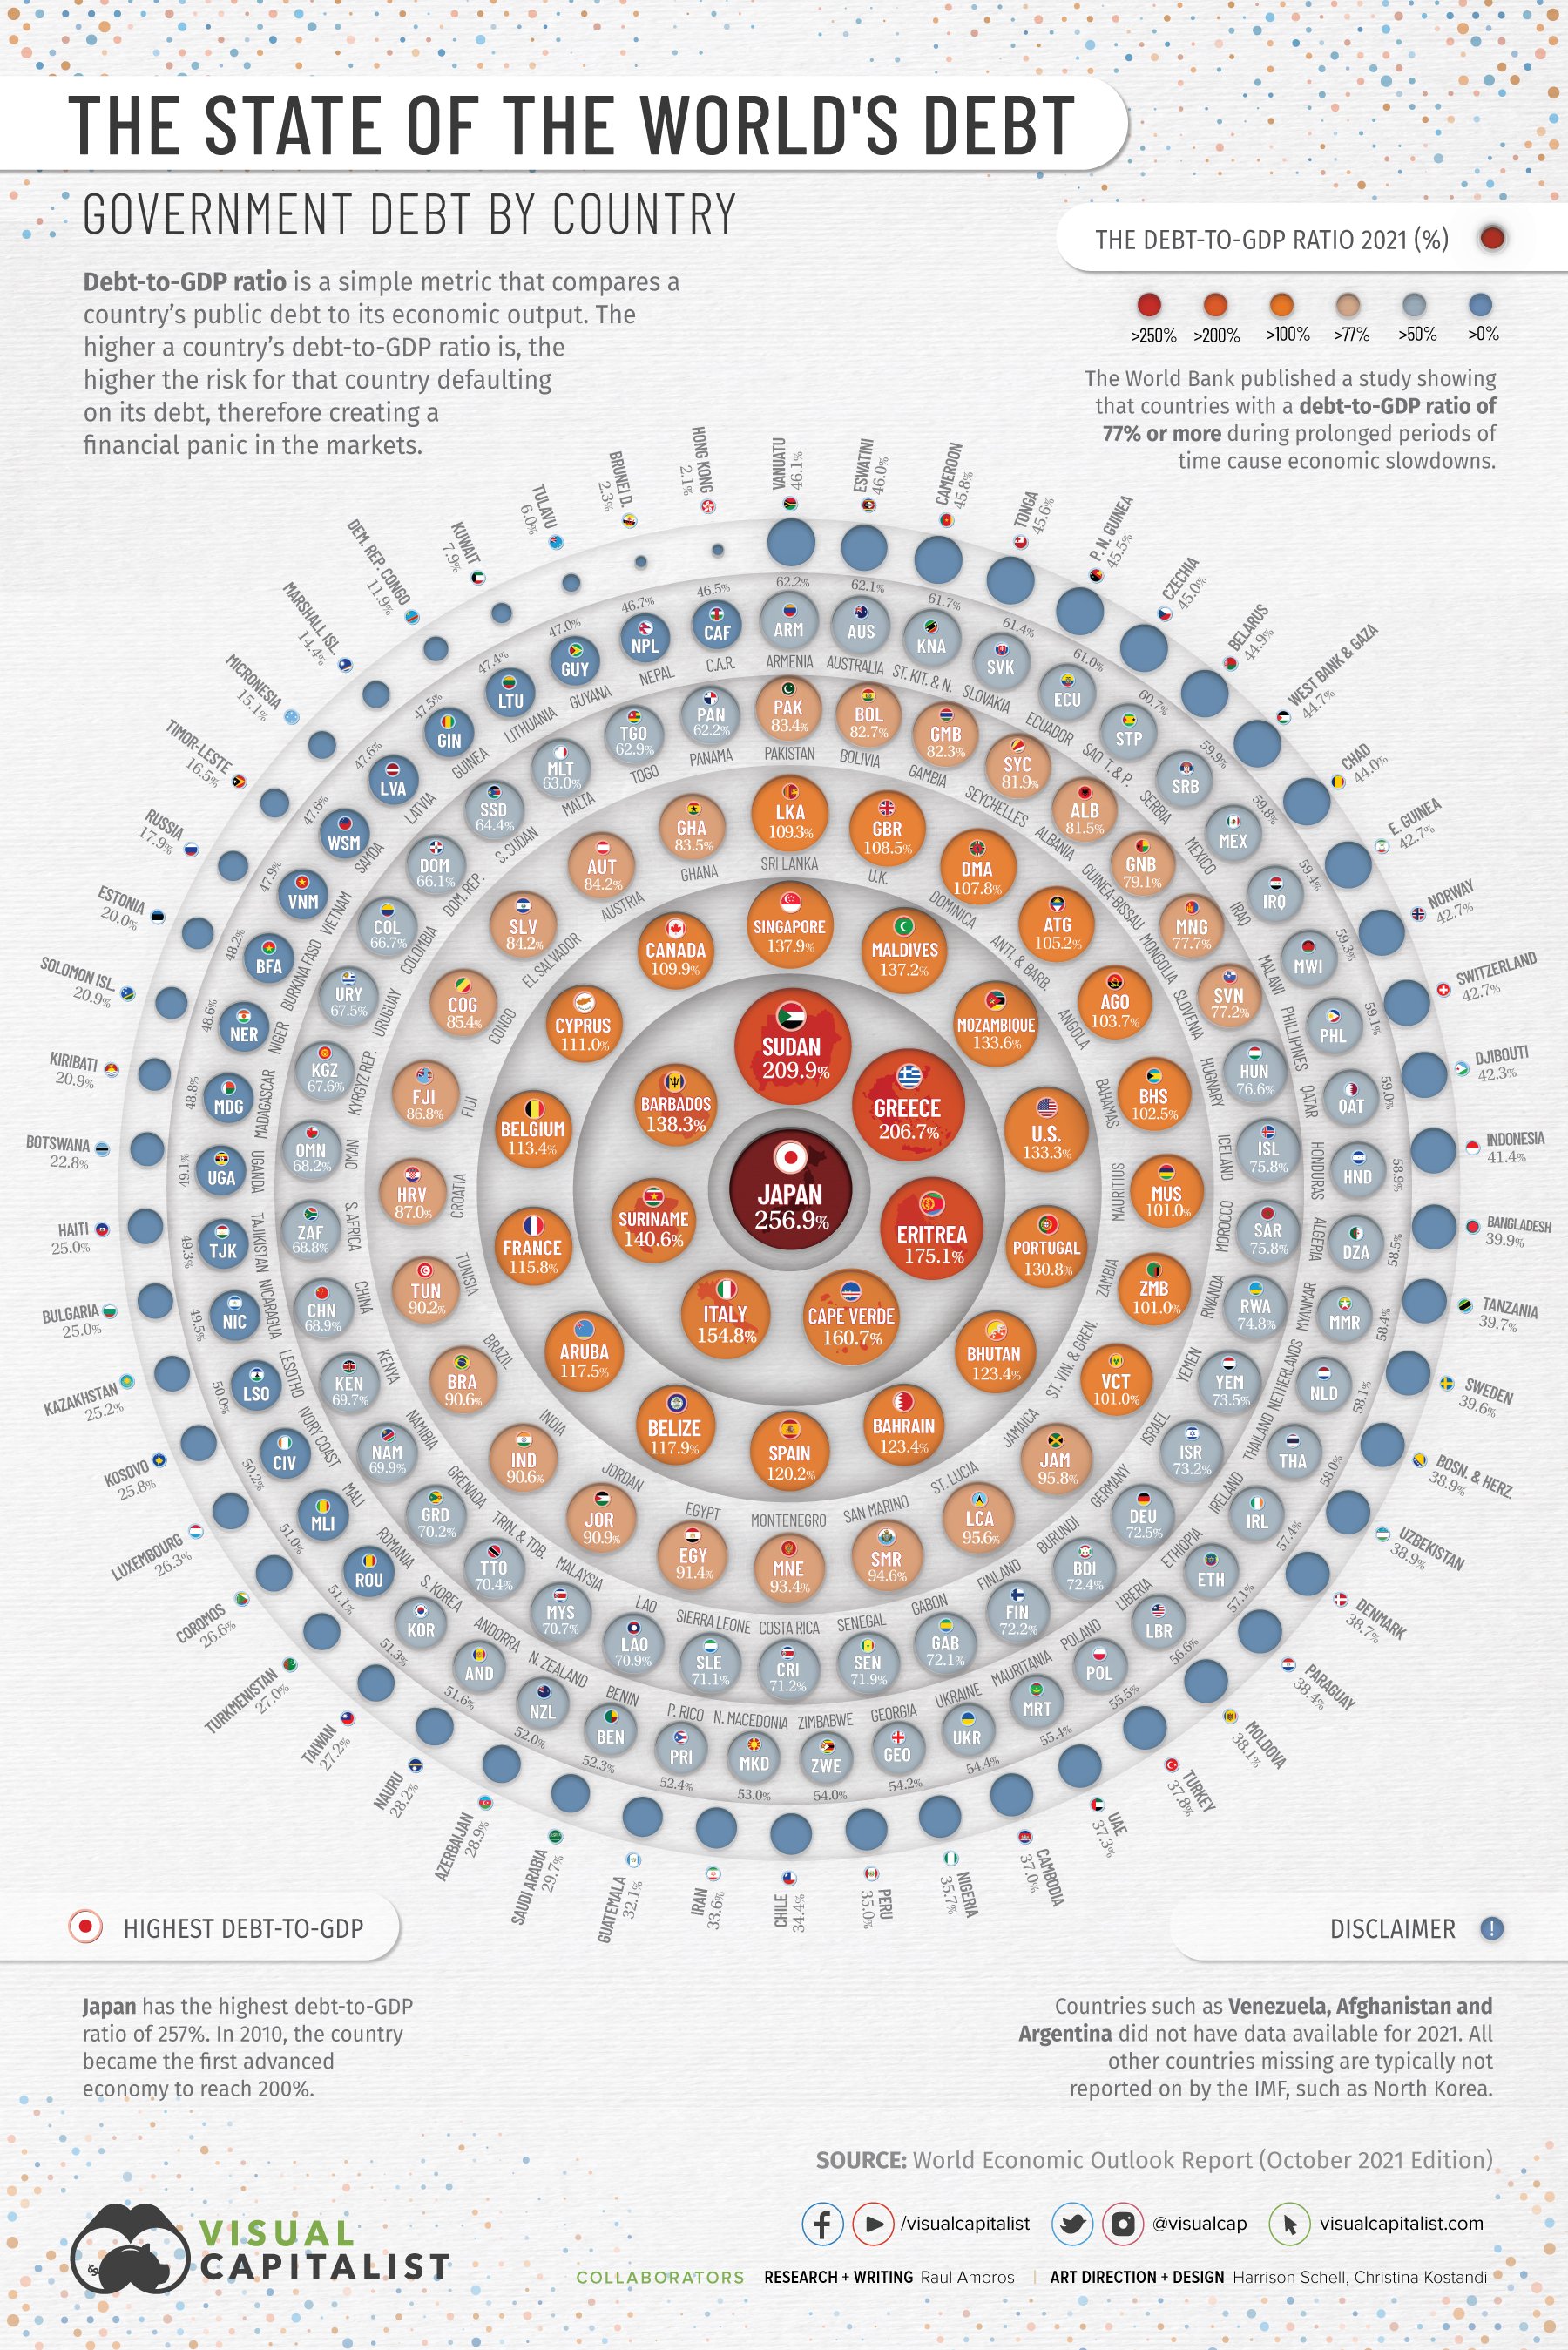
The debt-to-GDP ratio is a simple metric that compares a country’s public debt to its economic output. By comparing how much a country owes and how much it produces in a year, economists can measure a country’s theoretical ability to pay off its debt.
And if you’re looking for New Zealand, here’s a clue, we’re in the second-to-outer ring.
Click on the graphic to enlarge.